FACE · July 2026
Turtle Dove Report 2026
The sixth year of the EU Turtle Dove Adaptive Harvest Management: hunting cut by around 90% across both European flyways, a growing Western population, and early signs of stability in the Central/Eastern flyway.
Key takeaways
- 1 The yearly update of population trends in both flyways shows a continued increase in the Western flyway, and a continued decrease in the Central/Eastern flyway with some signs of stability in recent years.
- 2 Hunting was reduced by around 90% and now occurs at very low levels in both flyways; about 1% and 3% harvest rates in the Western and Central/Eastern flyways, respectively. The population model developed so far indicates that harvest rates up to 4% are sustainable.
- 3 All countries reported the number of Turtle doves harvested in 2025. This is mandatory in every country, and most are using mobile phone apps.
- 4 Compliance rates are very high, with very few infractions reported by Member States.
- 5 Research on the Turtle Dove continues, notably with studies conducted in Bulgaria showing an increase in breeding densities and good productivity.
- 6 The European Commission has produced a blueprint of habitat restoration measures for the Turtle Dove and other huntable birds, to inspire Member States in the development of their National Restoration Plans.
Introduction
Since its start in 2021, the EU Turtle Dove Adaptive Harvest Management (AHM) is now in its 6th year of implementation.
At this stage, reflecting back on the achievements highlights significant progress over the years. First, hunting has been reduced by 90% across both European flyways, to a level that is identified as sustainable, thereby virtually eliminating the potential threat posed by harvest.
Second, all Member States are implementing strict hunting quotas and have developed tools to accurately and timely report harvest, in order to follow the progress towards the quota and to close the Turtle Dove hunting season when reached. This represents a significant achievement, paving the way for real-time harvest reporting for other huntable species. This is complimented by extensive data on controls in the field showing very high compliance.
The Turtle Dove is increasing in the Western flyway, and, although still decreasing, signs of stability are visible in the Central/Eastern flyway.
In the Central/Eastern flyway, the absence of increase following the drastic reduction in harvest should serve as a trigger to look for other factors than hunting driving the population decrease. New research shows that breeding densities have increased recently and that a good productivity is achieved in Bulgaria. The situation could be different in other countries; the assessment of national level trends could shed some light in the population dynamics in this flyway.
This report 2026 provides detail on this year's update in the Turtle Dove AHM, its achievements so far, and ongoing progress.
2025 at a glance
The numbers behind the update
Chapter 1
What is the current population trend?
The Turtle Dove population dataset compiled by the Pan-European Common Bird Monitoring Scheme (PECBMS) was updated in April 2026 with the breeding season of 2025.
Continued increase in Western flyway
In the Western flyway, the 2025 breeding season corresponds to the fourth consecutive year of moratorium, as hunting was reopened in 2025. The 4-year moratorium period is therefore covered by the data.
This update shows a continued increase in the flyway, with an average annual increase rate of 9.6%. The population index in spring 2025 produced by PECBMS is the highest since 2009 (16 years).
Decrease in Central/Eastern flyway, but signs of stability
In contrast, the ongoing population decline in the Central/Eastern flyway continues, although the population index has remained somewhat stable since 2021.

Assessment of the flyways' 10-year trends produced by PECBMS
The compilation of the Turtle Dove 10-year trends available per flyway at each yearly update since the work on the AHM started offers interesting insights.
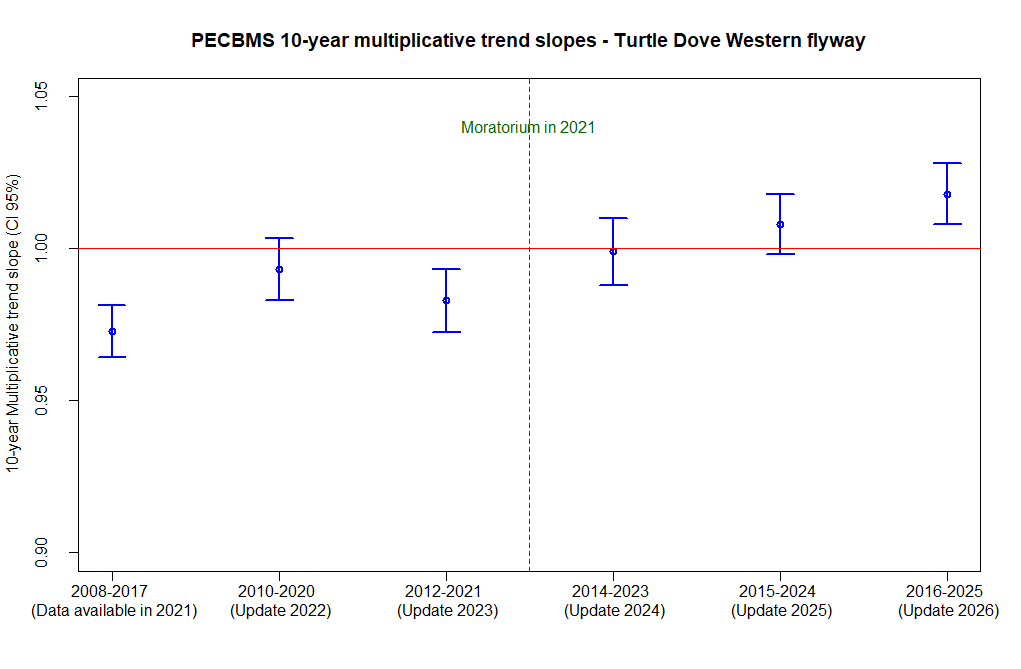
In the Western flyway, the yearly updates in 10-year trends show a clear improvement of the population trends since 2021, noting the trend was assessed as "stable" in 2022 before the moratorium (10-year trend 2010–2020).
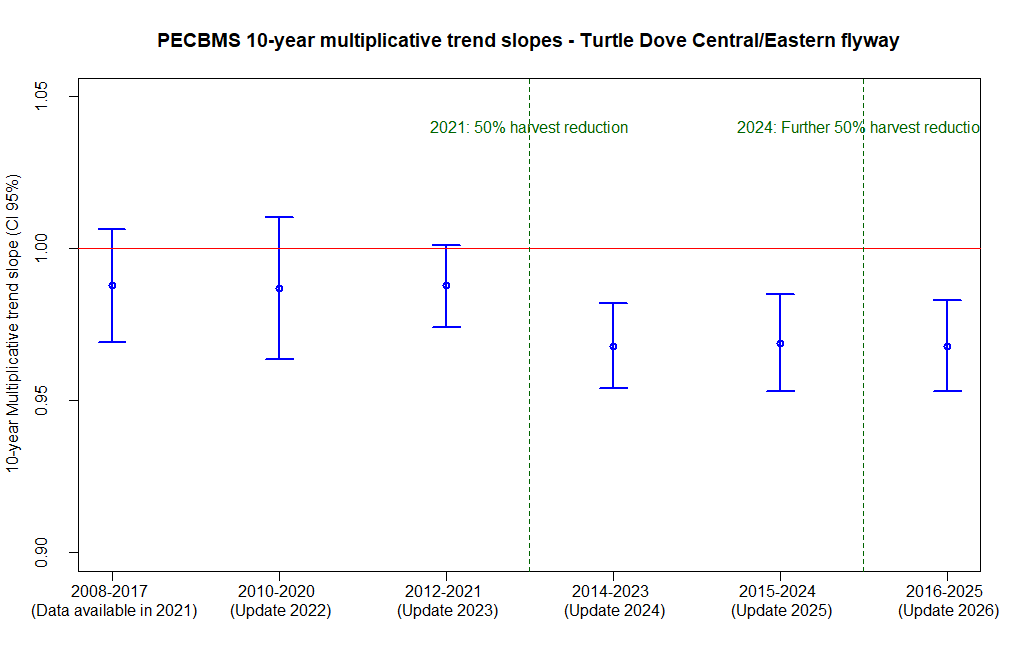
In the Central/Eastern flyway, the assessment of the yearly produced 10-year trends shows relative stability for the three updates before and after 2021. While the 10-year trends before 2021 were assessed as "stable" (as their confidence intervals crossed 1, meaning population growth, as per trend categories terminology by PECBMS), the 10-year trends after 2021 are assessed as "moderate decline". However, the 10-year trends' slope estimates remained similar over the last three updates.
Chapter 2
What are the current harvest levels?
2.1 Western flyway
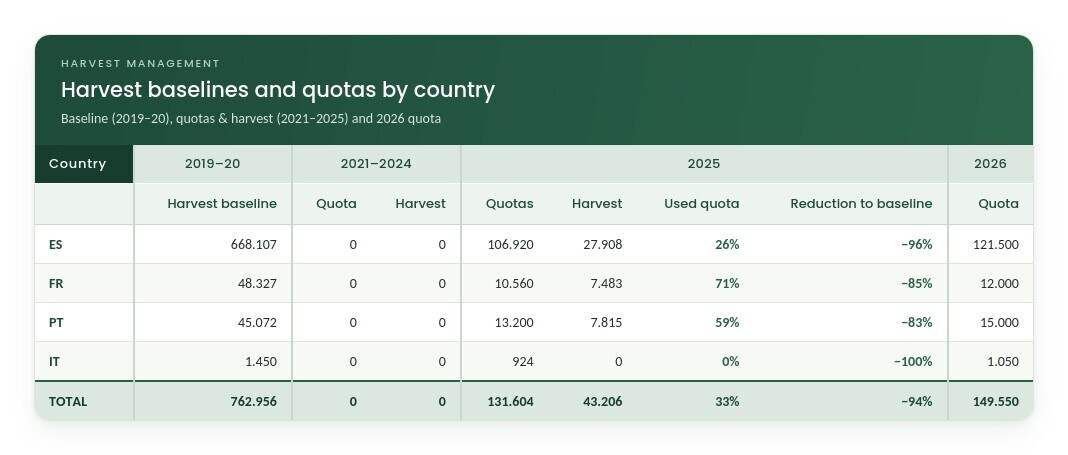
After four years of moratorium, hunting was reopened in 2025 with a very small harvest rate of 1.5%, which corresponded to a quota of around 130,000 birds.
However, in practice, only 33% of the quota was achieved, with a total of around 43,000 birds shot. This corresponds to a 95% reduction of hunting compared to the harvest baseline 2019–20.
Various parameters explain this underuse of the quota. For example, in France and Portugal, the news that hunting would be reopened came late in advance of the season, and hunters, after four years of moratorium, were not well aware. In Spain, many hunting grounds gave up their quota, which was not redistributed, to avoid the administrative burden deemed too high compared to the very small quota they would have received (e.g., especially for small hunting grounds). And hunting was not opened at all in the Italian regions belonging to the Western flyway.
How is the quota calculated?
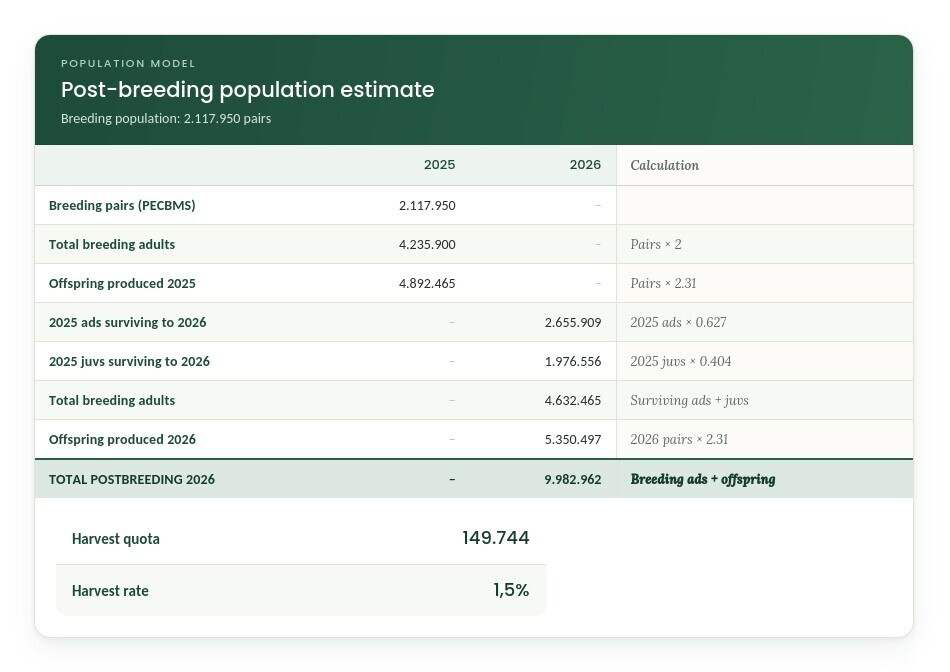
Within the framework of the EU Task Force on the Recovery of Birds, the harvest quota was calculated by estimating the post-breeding population size based on the breeding population size estimate in 2025.
As detailed in Table 2 below, applying the productivity and survival rate estimates to the 2025 breeding population allows generating an estimated post-breeding population size (i.e., the population size available for hunting) of around 10 million Turtle Doves in the Western flyway.
The agreed harvest rate of 1.5% then corresponds to approximately 150,000 birds.
This harvest rate was agreed upon following the results of the Turtle Dove Integrated Population Model (IPM) developed for the Western flyway over the last few years. The model highlighted that harvest rates up to 4% were associated with population growth (see FACE Turtle Dove report 2024). As a precautionary measure, a 1.5% harvest rate was selected.
The most recent projected trends based on the population in 2025 (data update 2026) show the significant population growth associated with harvest rates between 0% and 2%.

2.2 Central/Eastern flyway
Following the initial recommendations from the European Commission for a 50% harvest reduction in 2021, the harvest was substantially reduced since 2021. With a total ban on hunting in many Italian regions, the goal of a 50% reduction resulted in a 75% total reduction compared to the harvest baseline 2013-18. This level of harvest, set by national quotas, was followed for three consecutive years (2021, 2022, and 2023). In 2024, Member States in the flyway took the initiative to further reduce harvest, leading to an overall 90% reduction in hunting compared to the baseline (see Figure 5 and Table 3).
The 2025 harvest in the Central/Eastern flyway was 94,788 birds.
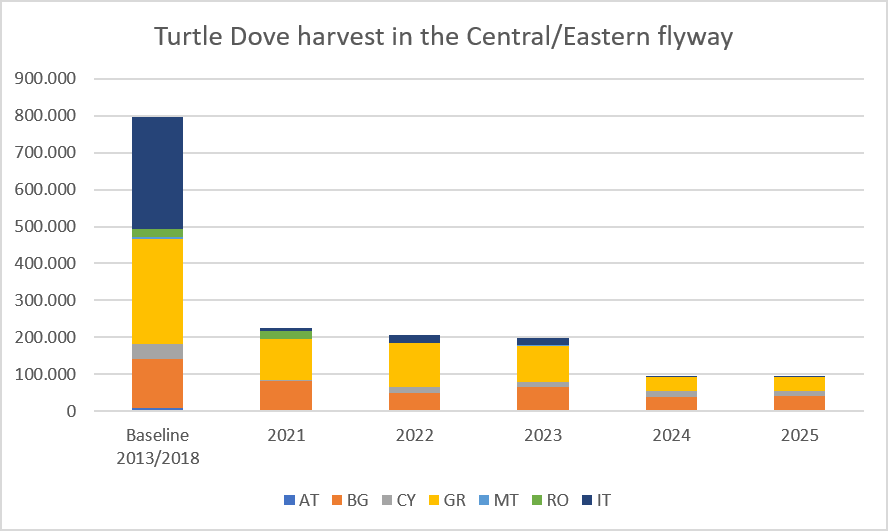
In Bulgaria, Cyprus, Greece, and Malta, the national quotas are usually reached, or close to being reached. However, there was no Turtle Dove hunting in Austria and Romania, and very limited hunting in Italy, as many Italian regions did not open a Turtle Dove hunting season.
To better understand these harvest numbers, they need to be compared to the population size available for hunting in the Central/Eastern flyway.
Applying the Task Force methodology used for quota calculation in the Western flyway (detailed above) to the Central/Eastern flyway situation generates an estimated post-breeding population size in 2026 of around 3 million birds in the Central/Eastern flyway.
This indicates that the quota set in 2024 and 2025 of around 95,000 birds would result in an estimated rate of 3.3% in 2026 (see detail in Table 3 below).
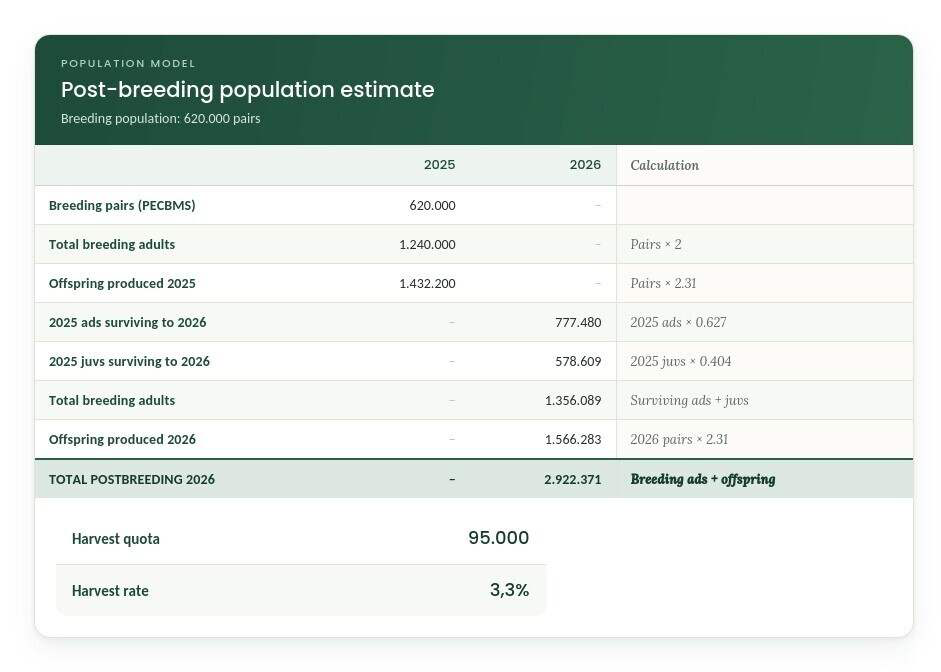
With a reduction in harvest of almost 90% corresponding to an estimated 3% harvest rate, hunting of Turtle Doves in the Central/Eastern flyway has been reduced to very low levels, in fact, close to a moratorium (see Figure 5).
Although the population has not recovered so far, it has somewhat stabilised since 2021 (see Figure 1).
It is worth highlighting that FACE analysed the PECBMS data at national level up to 2017 (see FACE's Turtle Dove report 2025), showing that the only countries in the Central/Eastern flyway in which the Turtle Dove has been increasing in that period are Greece, Bulgaria, and Romania, which are countries in which the species is huntable. An update of this data would be extremely useful to assess whether this is still the case.
When reflecting on the absence of population increase in the Central/Eastern flyway, two hypotheses were put forward by the European Commission's scientific consortium: (1) that under-reporting of harvest and/or illegal killing is taking place or (2) that, if harvest reporting is accurate, the current harvest rate is still too high to be sustainable. In practice, both hypotheses assume that hunting is a key limiting factor for the population.
However, these hypotheses are not supported by the current knowledge, as (1) enforcement data reported by Member States shows very high compliance (see point 3 on implementation below), in fact so high that infractions needed to be expressed in permille (‰) instead of percentage (%), and (2) the current 88% harvest reduction would be equivalent to a harvest rate of about 3%, which is identified as sustainable for the Western flyway. Such harvest rate is in fact very close to a moratorium so that it is unlikely that stopping the remaining hunting altogether will result in a significant change of population trend.
This highlights the lack of consideration for other hypotheses, e.g., that hunting is not among the main drivers of population change in the Central/Eastern flyway, or that the population trend is not representative (e.g., by missing Turtle Dove core areas).
To better reflect on this, the PECBMS trends (and related sample sites) should be assessed at national level as they could yield significant information.
FACE would recommend exploring other hypotheses as regards the lack of change in population trend, including by assessing the national PECBMS trends.
Chapter 2.3 · Case study
Are rapid assessments of hunting sustainability accurate?
In 2024, the European Commission performed a rapid assessment of hunting sustainability for 30 migratory bird species of Annex II, which are not in a secure EU status (2013-18). As the Turtle Dove AHM process was already ongoing, the Turtle Dove was not included in this assessment.
However, we can apply this assessment retrospectively to the Turtle Dove to test it reliably. This is a useful test for future application of the method.
2.3.1. The methodology
The approach used to perform the assessment is the Prescribed Take Level method (PTL, Runge et al., 2009). This complex methodology has been made easily accessible to a broad range of stakeholders, wildlife managers and decision-makers through the recently designed R-package Popharvest (Eraud et al, 2021). This package was specially designed to provide a first assessment of the sustainability of bird harvest, using only sparse or incomplete data.
As it requires few parameters, it provides a useful starting point for assessing allowable take within a bird population with limited demographic information.
In this application of the PTL approach, the parameters required are population size estimates, harvest estimates, as well as a few demographic parameters to estimate the population growth rate (age at first reproduction, living rate and adult body mass).
Briefly summarized, the PTL approach derives a Maximum Sustainable Yield (MSY, equivalent to half the population excess growth), which can be compared to current hunting bags to assess whether they are sustainable with regard to a predefined management objective. This is done by generating a Sustainable Harvest Index (SHI) through a high number of simulations, which indicates the probability of harvest being unsustainable (with regard to the chosen management objective).
The possibility to formulate management objectives is an important aspect of the PTL approach as it allows to assess whether current harvest levels are sustainable with regards to ecological, economical, or cultural requirements.
The management objective is a value judgment, it is a priori (arbitrarily) specified within the formulation of the PTL as a scaling factor representing the take level relative to MSY, on a 0 to 1 scale. Setting it to 1 means that harvesting the MSY (half the population growth) is deemed sustainable.
In other words, setting the management objective to 0.5 means the users' value judgment is that harvest should not be higher than half of the MSY, or than half the population growth. In this case, the harvest is deemed unsustainable if it is higher than a quarter of the population growth. If the management objective is set at 0.25, the harvest is deemed unsustainable if it is higher than 12.5% (1/8) of the population growth.
Importantly, the bird population trends are not taken into account when using popharvest, the management objective can therefore be used as a safety by being set lower for decreasing populations, or, on the contrary, can be set higher for increasing populations that are well able to sustain harvest.
In any case, it is crucial to note that this exercise provides a first assessment of the sustainability of bird harvest, which forms a useful starting point for assessing harvest levels but requires a second stage assessment for ground-truthing the results. As per the authors' own words, "while popharvest provides a useful platform for rapid assessments of sustainability, it cannot substitute for sufficient expertise and experience in harvest theory and management" (Johnson et al., 2024).
In their application of this methodology (TFRB 26-02-05), the European Commission used the following traffic-light thresholds to classify harvest sustainability for each species/population:
This means that the European Commission's management objective is to harvest less than a quarter of the Maximum Sustainable Yield.
In other words, a quarter of the MSY is where the European Commission draws the line between sustainability and unsustainability of harvest.
This is a precautionary approach, especially as it does not take population trends into account. While this approach can make sense when the trend is decreasing, it would be too restrictive when the trend is increasing, as sustainable harvest levels risks be labelled as "red" (i.e., unsustainable") using these thresholds.
Note that this methodology has been developed for huntable species in unsecure status, but that many have increasing wintering trends, the relevant trends to assess when discussing hunting sustainability.
2.3.2 Application for the Turtle Dove's current levels of harvest
Applying this methodology to the current situation regarding harvest (in 2025) results in a green light for the Western flyway, while the Central/Eastern flyway is just at the limit between green and amber, with the SHI being around 50% with the management objective set at 0.25.
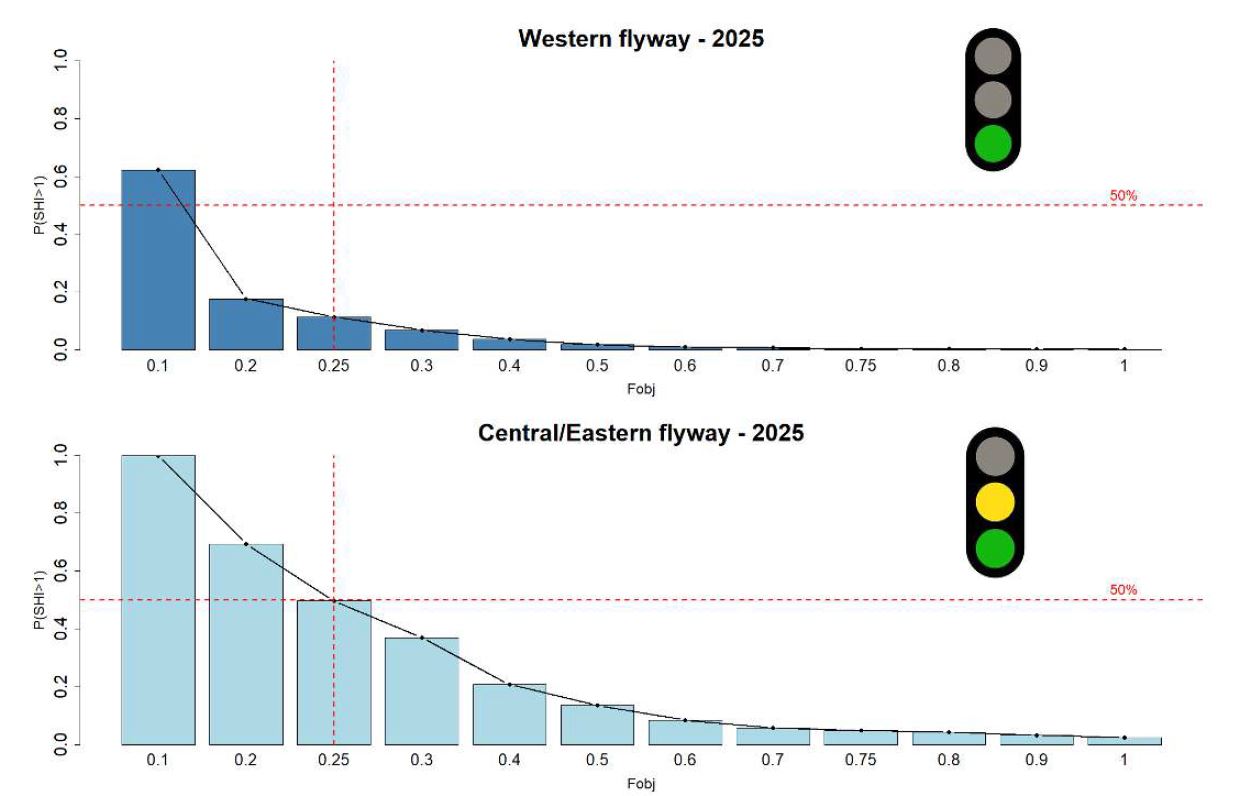
This means that, according to popharvest, the current harvest levels in the Central/Eastern flyway, of about 95,000 birds, is equal to the Prescribed Take Level (PTL) at the management objective (Fobj) set at 0.25. In other words, if the management objective (i.e., the goal) was to allow harvest of only a quarter of the Maximum Sustainable Yield (MSY), which corresponds to 12.5% of the population growth as the MSY is half of the population growth, the goal would be met. Therefore, this meets the European Commission's threshold.
For the Western flyway, this means that, again according to popharvest, the current quota is much lower than the European Commission's threshold for assessing harvest levels as green.
2.3.3 Comparison with the EU Task Force work
As seen above, work within the EU Task Force showed very low current harvest levels with 1.5% maximum in the Western flyway for the season 2026, and extending to 2025 and the Central/Eastern flyway, in the order of 1% and 3% in the Western and Central/Eastern flyways, respectively (see Table 2 and 3).
The rapid assessment of harvest sustainability using popharvest allows for an interesting comparison between this quick and easy approach and the results of the Integrated Population Model (IPM) developed over the last few years, a more demanding approach.
The Turtle Dove IPM developed in the Task Force produced a sustainable harvest rate of up to 4% for the Western flyway.
Using popharvest and the European Commission thresholds of the rapid assessment of harvest sustainability, a Prescribed Take Level (PTL) of about 330,000 Turtle Doves is produced for the management objective threshold (0.25) for a "green" classification. This PTL is equivalent to a 4.8% harvest rate (based on popharvest's predicted population growth rate and the Western flyway population size).
Further, the 1.5% quota for the Western flyway was estimated to represent 150,000 Turtle Doves by the European Commission (Table 2). When using popharvest, the harvest of 150,000 Turtle Doves is estimated to be equivalent to a 2.1% harvest rate, using the same logic as above.
In this case study, these two very different approaches, one quick and easy to implement (popharvest), the other more demanding in time and resource (IPM), yielded very similar results.
This is an encouraging sign that management is on the right path, but could also mean that very straightforward tools could gain more importance in harvest management in the future.
For example, an IPM is still lacking for the Central/Eastern flyway, pending new productivity and survival estimates within the flyway. Popharvest could potentially provide an informative basis in the meantime.
Chapter 3
What about implementation and control in the field?
3.1 Harvest reporting systems
Western flyway. All countries hunting the Turtle Dove in 2025 in the Western flyway had a mandatory bag data reporting system consisting of a smart phone application reporting system, complemented in some cases by website online reporting and/or paper forms, although less used.
Central/Eastern flyway. All countries have a mandatory bag data reporting system.
3.2 Turtle Dove inspection data 2024 and 2025
The European Commission services requested information from Member States about activities carried out in the years 2024 and 2025 for the Turtle Dove via questionnaires. This included a request for information on control and implementation.
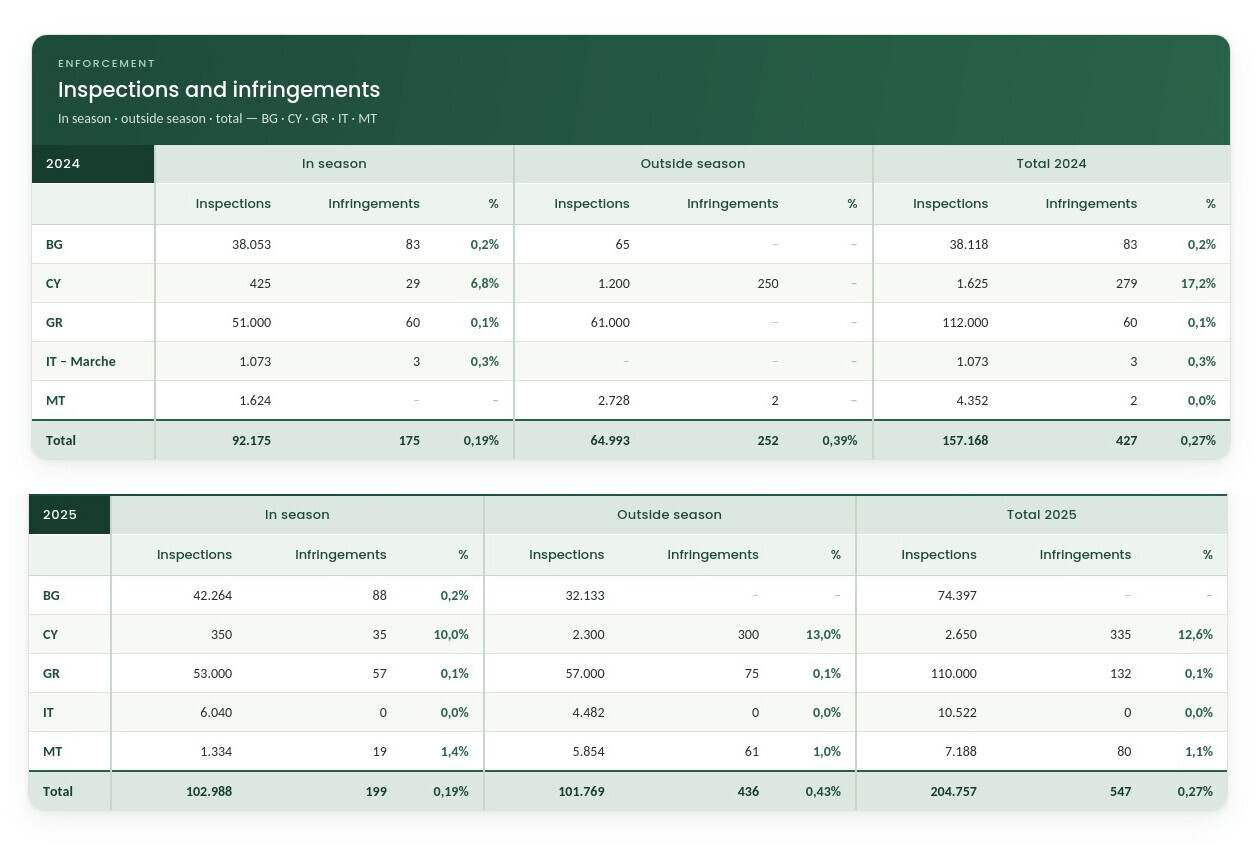
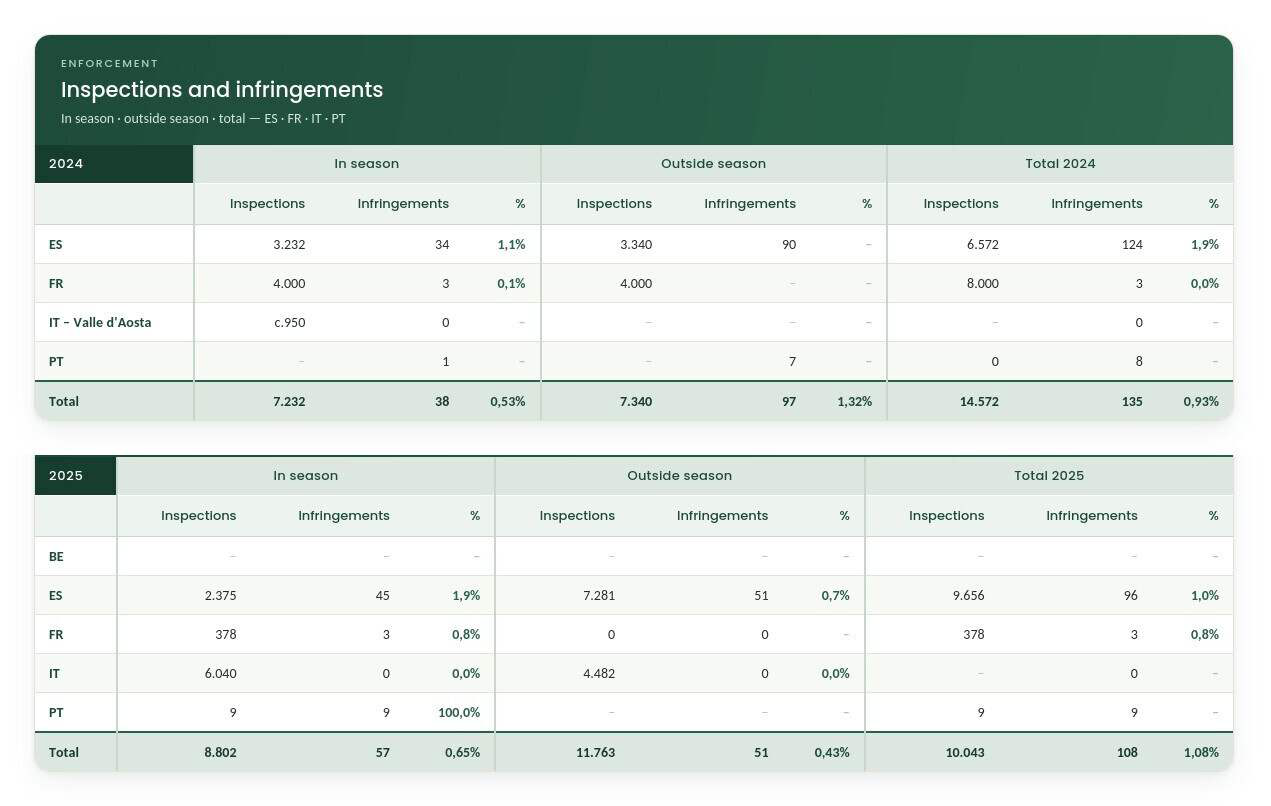
Inspection data reported by Member States for the years 2024 and 2025 are quite similar, highlighting a large number of inspections and a very low number of infractions detected. Globally, infractions account for less than 1% of inspections, except in Cyprus, where a higher rate is found; see Tables 5 and 6.
It must be noted that infractions are not limited to Turtle Dove illegal killing, but to the full range of possible infractions to the hunting regulations, including, for example, being late in renewing a licence.
The conclusion drawn from such a dataset is that hunters abide by the law, and compliance is not an issue. It would therefore be very unlikely that significant numbers of Turtle Doves are shot illegally.
Chapter 4
What about new research?
4.1 New studies in Bulgaria
A significant step forward in improving knowledge specific to the Central/Eastern flyway was achieved by Bulgaria, where studies showed a 50% increase in nesting densities — from a stable 10.2 to 10.9 nesting pairs per 100 ha between 2022 and 2024, to an increase to 16.3 nesting pairs per 100 ha in 2025. They also found an average productivity of 3.24 fledged juveniles per nest over the breeding season 2025.
This new productivity data should now be used to update the population model under development for the Central/Eastern flyway, a longstanding request from the European Commission's consortium.
4.2. The collection of wing data continues
The collection of wing data continues in several countries, such as Spain, France, Greece, Italy, and Portugal.
The main novelty is that the phone application used in France to register harvest (ChassAdapt) now provides a state-of-the-art tool to collect Turtle Dove wing data, as well as AI reading of the wings with very good accuracy.
A total of 1,826 usable wing pictures were collected, which analysis showed a total age-ratio of 3.14 juveniles per adult (CI 95% 2.82–3.5), so that juveniles represented 76% of the harvest.
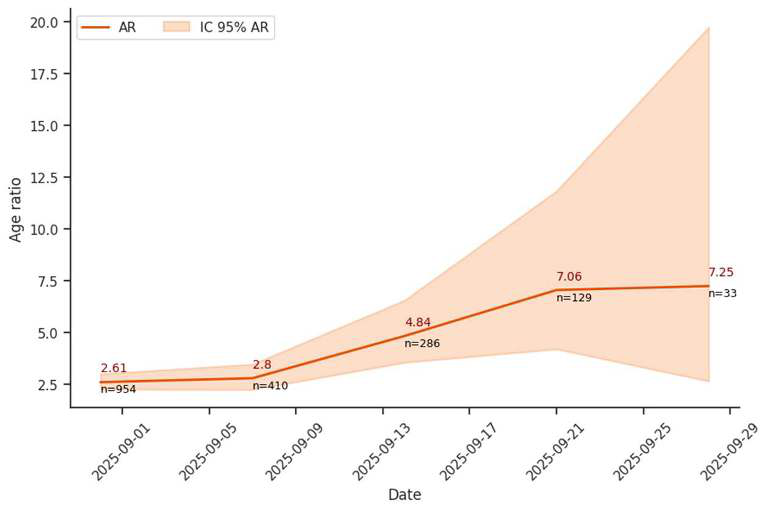
It is commonly accepted that good age-ratio in the harvest, used as an index for the real age-ratio in the population, reflects a good population productivity. Hence, these numbers are a good sign regarding the health of the Turtle Dove population in the Western flyway.
Chapter 5
Last but not least: restoring habitats
Loss of habitats is the first driver of decreasing bird populations and biodiversity loss. Restoring habitats in the EU is therefore a priority for the recovery of birds, including the Turtle Dove.
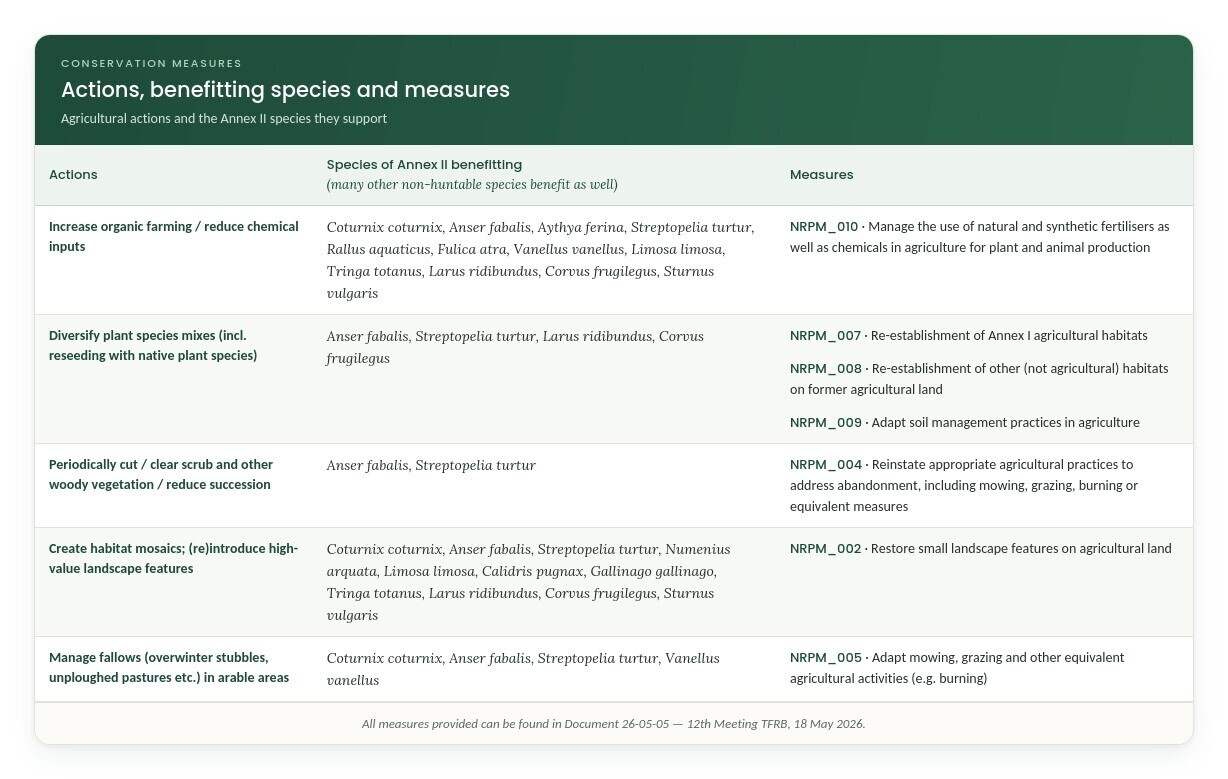
The EU Task Force on the Recovery of Birds produced a set of habitat actions to support Member States in the development of their National Restoration Plans (NRPs), as required by the Nature Restoration Regulation (NRR). The following sub-set of measures were advised for the Turtle Dove, as well as other species.
In the field
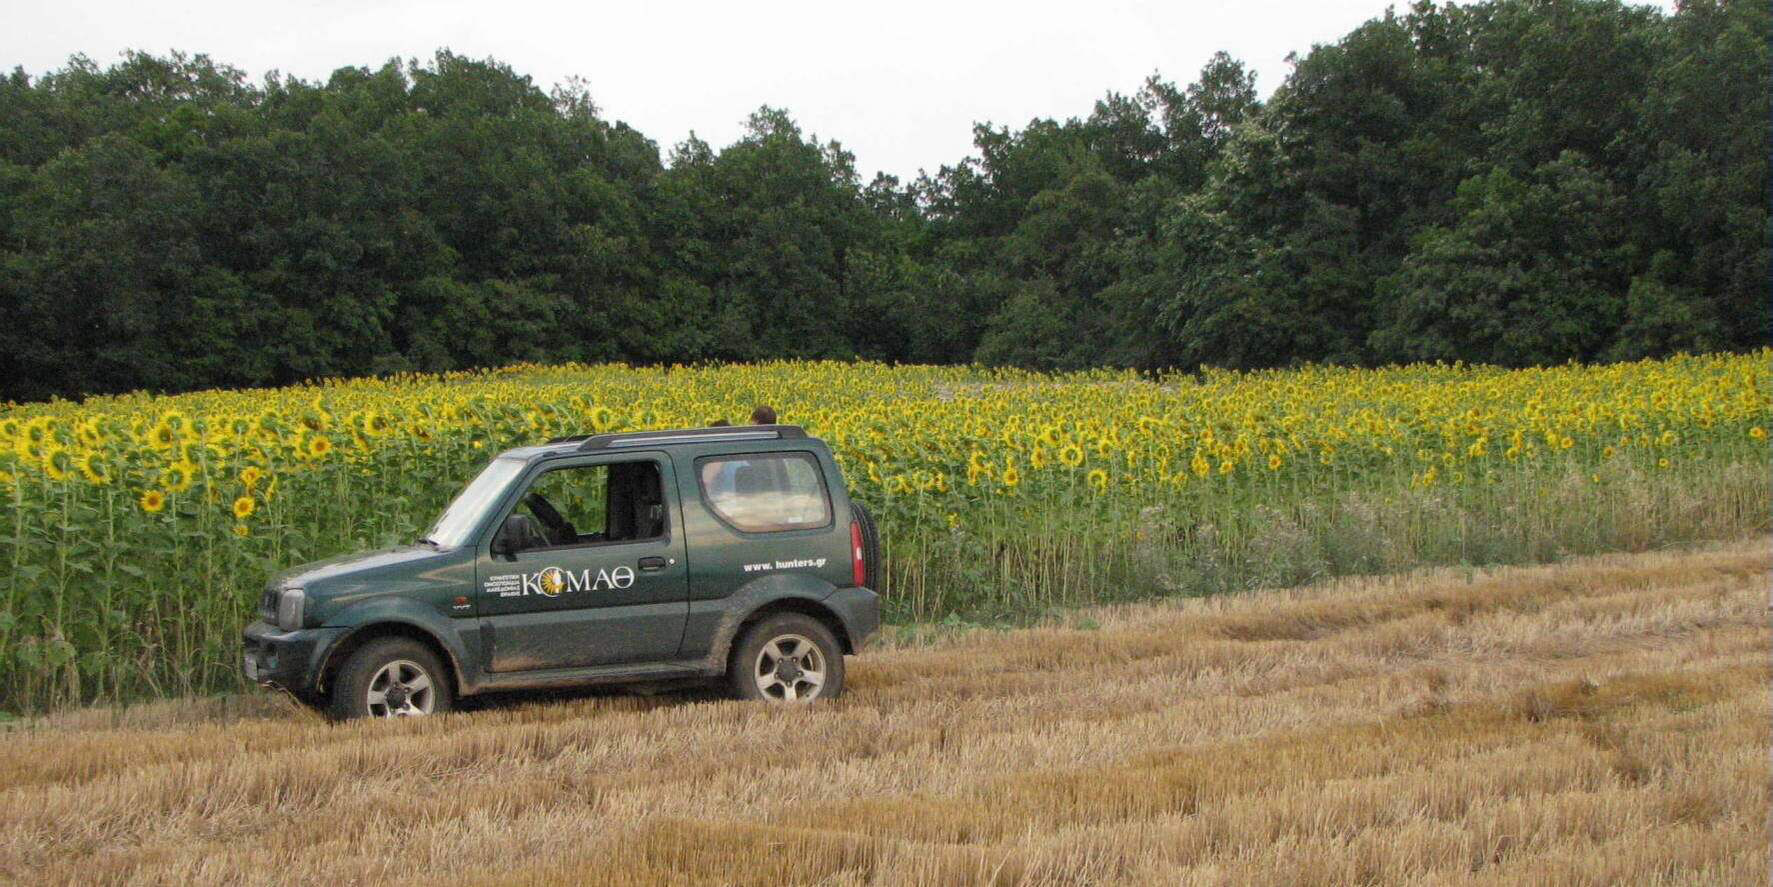
Monitoring, harvest control and habitat restoration

"While popharvest provides a useful platform for rapid assessments of sustainability, it cannot substitute for sufficient expertise and experience in harvest theory and management."Johnson et al., 2024 — on the popharvest R-package used in this report's case study
Six years of Adaptive Harvest Management
Timeline of the Turtle Dove AHM
The EU Turtle Dove Adaptive Harvest Management begins. The European Commission recommends a 50% harvest reduction in the Central/Eastern flyway; a moratorium starts in the Western flyway.
Central/Eastern flyway harvest held at roughly 75% below the 2013–18 baseline through national quotas; Western flyway remains under moratorium.
Central/Eastern Member States further reduce harvest, reaching an overall 90% reduction versus baseline. Bulgarian studies begin showing higher nesting densities.
Hunting reopens in the Western flyway after four years of moratorium, at a precautionary 1.5% harvest rate (≈150,000-bird quota); only 33% of the quota is used. Central/Eastern harvest reaches 94,788 birds.
PECBMS data update confirms continued Western flyway growth (+9.6%/yr) and shows Central/Eastern stabilisation. The European Commission publishes a blueprint of habitat restoration measures for National Restoration Plans.
Hunting within sustainable limits
With harvest reduced by around 90% in both flyways and very high reported compliance, hunting has been brought within levels identified as sustainable by the Turtle Dove Integrated Population Model.
Two flyways, two trajectories
The Western flyway is growing steadily; the Central/Eastern flyway remains in decline but has stabilised since 2021 — a pattern that harvest reduction alone has not reversed.
Other drivers deserve more attention
High compliance and low harvest rates in the Central/Eastern flyway point to factors beyond hunting — habitat loss and quality chief among them — as likely drivers of the ongoing decline.
Habitat restoration is the next frontier
The European Commission's blueprint of agricultural habitat measures gives Member States a concrete basis for National Restoration Plans that benefit the Turtle Dove and other Annex II species.
Get the full report
Download the FACE Turtle Dove Report 2026
Get the complete PDF report from FACE — European Federation for Hunting and Conservation, including the full literature list and source tables.